crude weekly trend – fuel oil markets – FO LDO price prediction
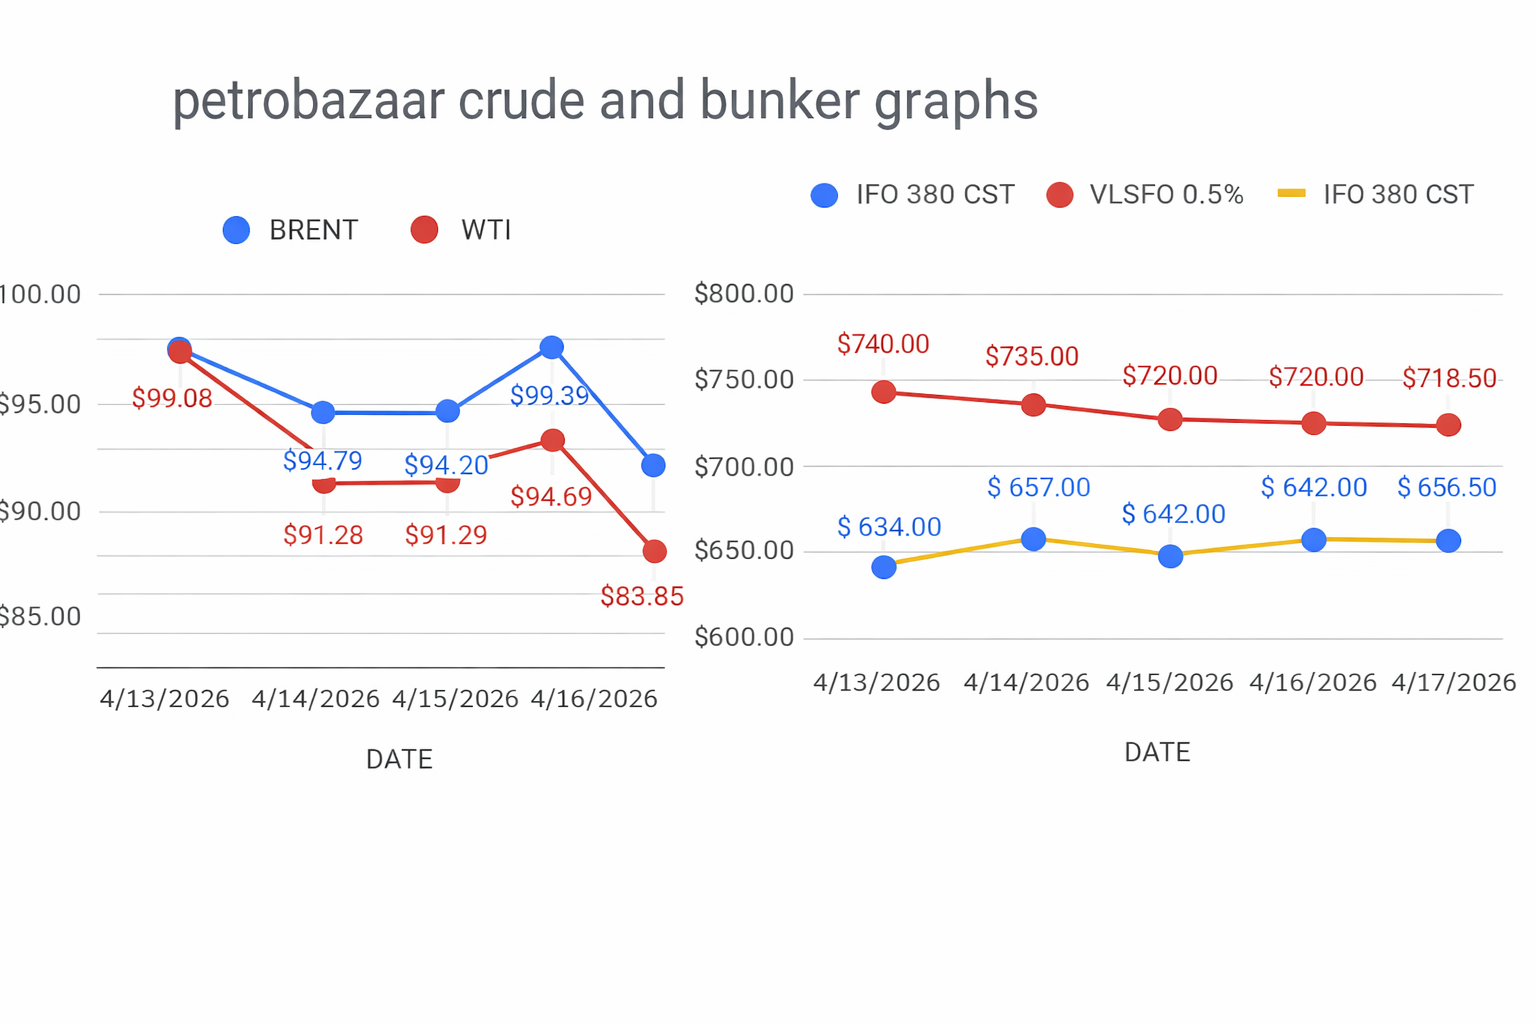
crude flat prices collapsed this week after Iran’s announcement of opening SoH. Brent prompt futures for June delivery Cratered around 9 pct to just above $90 on Friday. Timespreads weakened alongside of flat prices as prompt time spreads of major benchmarks fell back to their least backwarded levels. Weekly reports signaled mixed trends. A large armada of tankers heads for US gulf coast drew U.S Crude stocks. European nos shown moderate inventory declines. SG flooded with large inflex. Product markets also weakened. Diesel cracks plunged. Refined products margins keep uphold. Speculators were the net sellers of major crude F&O this week Through reports on Tuesday. I expect bears fest will continue.
FUEL OIL MARKETS
Fuel oil markets demonstrated downside momentum during last week, driven by supply fundamentals not by demand fundamentals. HSFO seen slight recovery from beginning of the week while VLSFO dipped. Relatively tight inventories and limited arbitrage from the West have supported HSFO prices. Demand seems to be moderate. FO prices revised down in India.